At 6 weeks, B6-Alms1 mutant mice developed classic MASH symptoms under Western diet feeding, with symptoms including significant systemic metabolic disorders (such as obesity and hyperlipidemia) and severe steatosis, inflammation, hepatocytic ballooning, and mild liver fibrosis. By 8 weeks, the mutant mice became obese and hyperglycemic, while fatty liver took 20 weeks to develop.
Data Validation
1. Body Weight
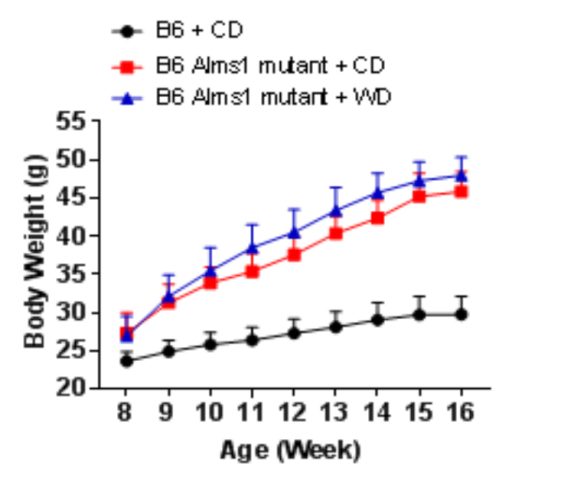
Figure1. The B6-Als1-del MASH model gained weight. Data are presented as Mean±SD. n=5-15.
2. Liver Morphology
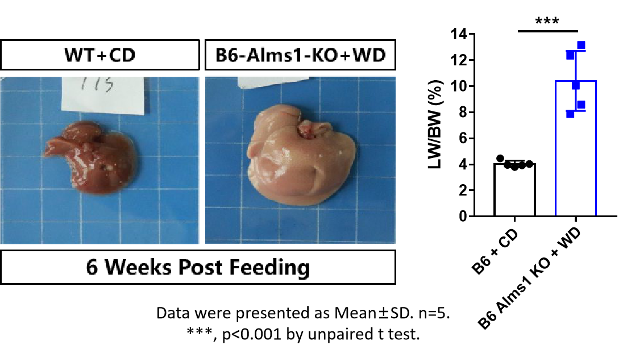
Figure 2. After 6 weeks of feeding, the B6-Alms1-del MASH mice exhibited a severe fatty liver phenotype. Data are presented as Mean±SD, n=5. ***, P<0.0001 by unpaired t test.
3. Plasma Chol and LDL-C
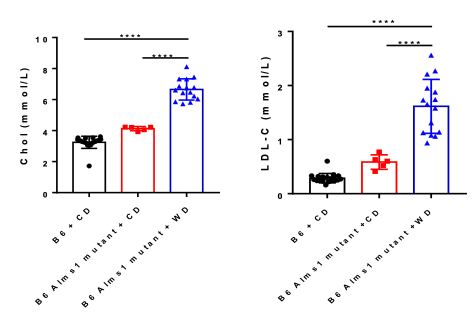
Figure 3. After 6 weeks of feeding, plasma cholesterol and LDL cholesterol levels were considerably increased in the B6-Alms1-del MASH model. Data are presented as Mean±SD. n=5-15. ****, p<0.00001 by one way ANOVA with Tukey’s post hoc test.
4. Liver TG and Chol
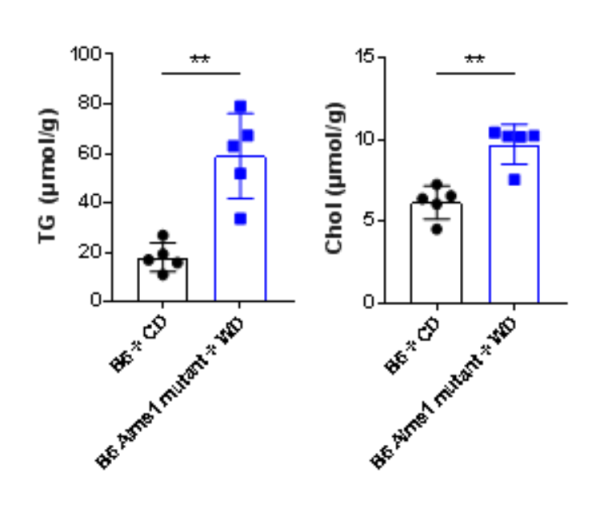
Figure 4. After 6 weeks of feeding, liver TG and total cholesterol levels were considerably increased in the B6-Alms1-del MASH model. Data are presented as Mean±SD. n=5-15. ****, p<0.01 by unpaired t test.
5. Plasma liver enzymes
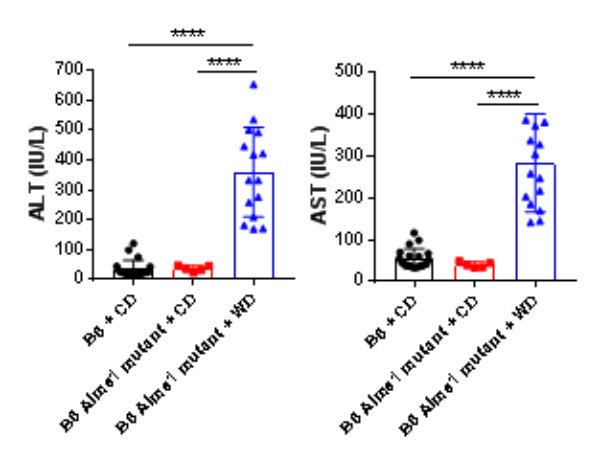
Figure 5. After 6 weeks of feeding, plasma liver enzymes levels were considerably increased in the B6-Alms1-del MASH model. Data are presented as Mean±SD. n=5. ****, p<0.01 by unpaired t test.
6. Histopathology
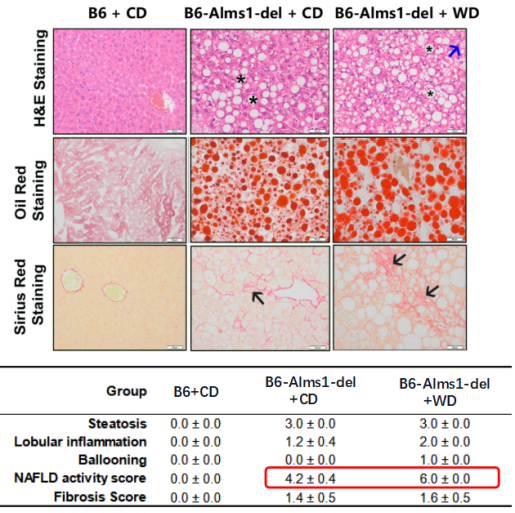
Figure 6. At 21 weeks of age, B6-Alms1-del mice given conventional diet (CD) developed a fatty liver phenotype, but the score was only 4.2 and did not reach MASH levels. Following 6 weeks of Western diet (WD), B6-Alms1-del mice exhibited phenotypes of severe steatosis, inflammation, ballooning lesions, and moderate fibrosis. The NAS score was 6.0, and the fibrosis score was 1.6.
Efficacy data
1. Body Weight
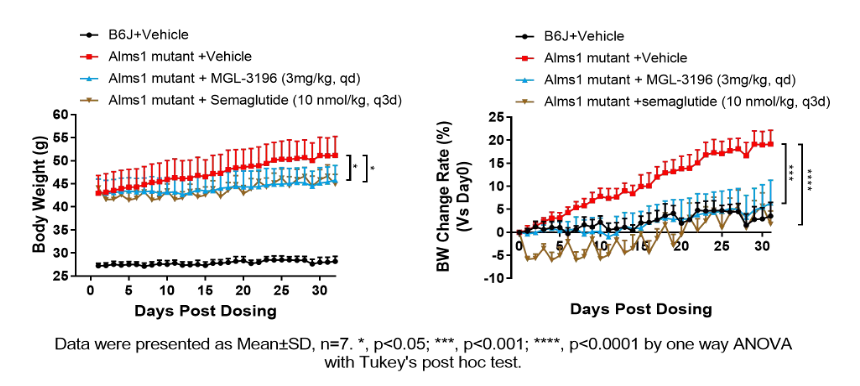
Figure 7. MGL-3196 and Semaglutide significantly reduced body weight in B6-Alms1-del MASH model. Data are presented as Mean±SD. n=7. *,P<0.05;***,P<0.001;****,P<0.0001; by one way ANOVA with Tukey's post hoc test.
2. Blood Lipid levels

Figure 8. MGL-3196 and Semaglutide improved dyslipidemia and liver function in the B6-Alms1-del MASH model. Data are presented as Mean±SD. n=5-7. ***,P<0.001;****,P<0.0001; by one way ANOVA with Tukey's post hoc test.
3. Liver Enzymes Levels

Figure 9. MGL-3196 and Semaglutide improved the levels of liver enzymes ALT and AST in the B6-Alms1-del MASH model. Data are presented as Mean±SD. n=5-7. ***,P<0.001;****,P<0.0001; by one way ANOVA with Tukey's post hoc test.

