Study Outline

Figure 1. HFD: 60% high-fat diet; HFHSD: 45% high-fat, high-sugar diet. Experimental period: 12-20 weeks.
Data Validation
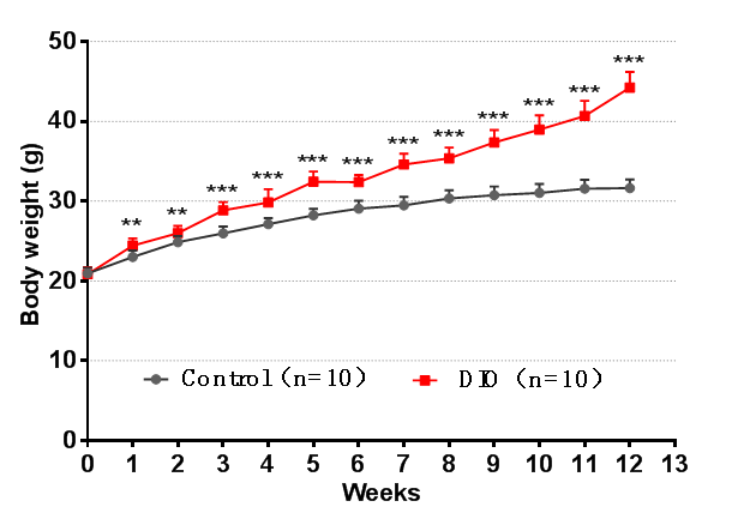
1. Body weight curve
Figure 2. 60% high fat feeding caused rapid increase of body weight of C57BL/6J mice. Data are presented as Mean±SEM.**, p<0.01;***, p<0.001 vs control by unpaired two-tailed Student's t-test.
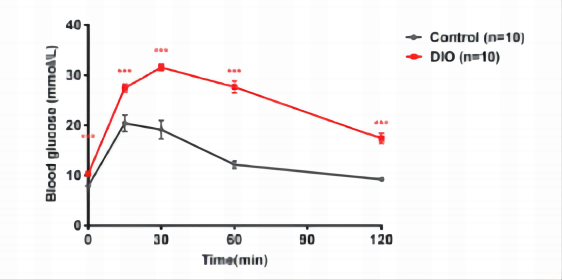
2. Glucose tolerance test

Figure 3. Control and DIO mice (feeding HFD for 12 weeks) were fasting for 6 hours and then gavaged with 2g/kg glucose solution. Blood glucose was measured at 0, 15, 30, 60, 90 and 120 min after glucose gavage. The glucose tolerance of DIO mice was significantly impaired when compared with control mice. Data are presented as Mean±SEM. ***, p<0.0001 vs control by unpaired two-tailed Student's t-test.***,P<0.001.
3. Serum insulin level

Figure 4. After 6 hours of fasting, insulin levels were measured at 0 and 15 min in the oral glucose tolerance test. Insulin levels of DIO mice were significantly higher than those in the control group. Data are presented as Mean±SEM. ***, p<0.001 vs control by unpaired two-tailed Student's t-test.
Efficacy data
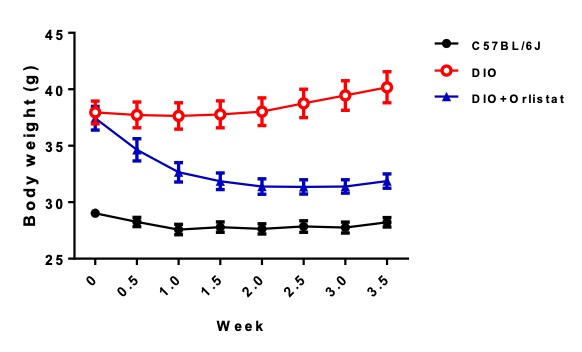
1. Orlistat significantly reduced the body weight of DIO mice

Figure 5. Orlistat significantly reduced the body weight of DIO mice. Data are presented as Mean±SEM. n=10 for each group.
2. Orlistat significantly reduced the body fat ratio of DIO mice
Figure 6. Orlistat significantly reduced the body fat ratio of DIO mice after 28 days treatment. Data are presented as Mean±SEM.***, p<0.001 by one way ANOVA with Tukey’s post unpaired hoc test.
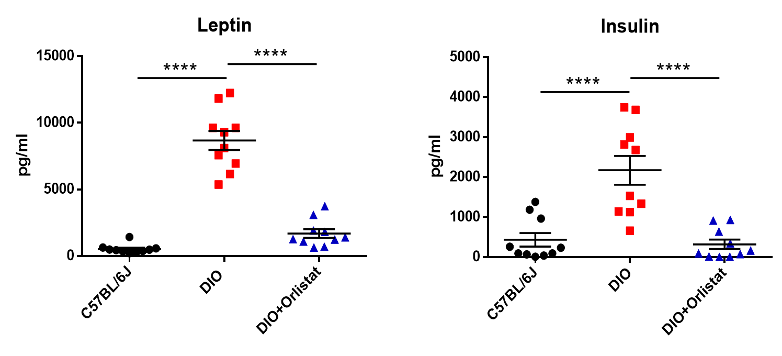
3. Orlistat significantly reduced the serum leptin and insulin levels of DIO mice

Figure 7. Orlistat significantly reduced the serum leptin and insulin levels of DIO mice after 28 days treatment. Data are presented as Mean±SEM.***, p<0.001 by one way ANOVA with Tukey’s post hoc test.


